Dashboard
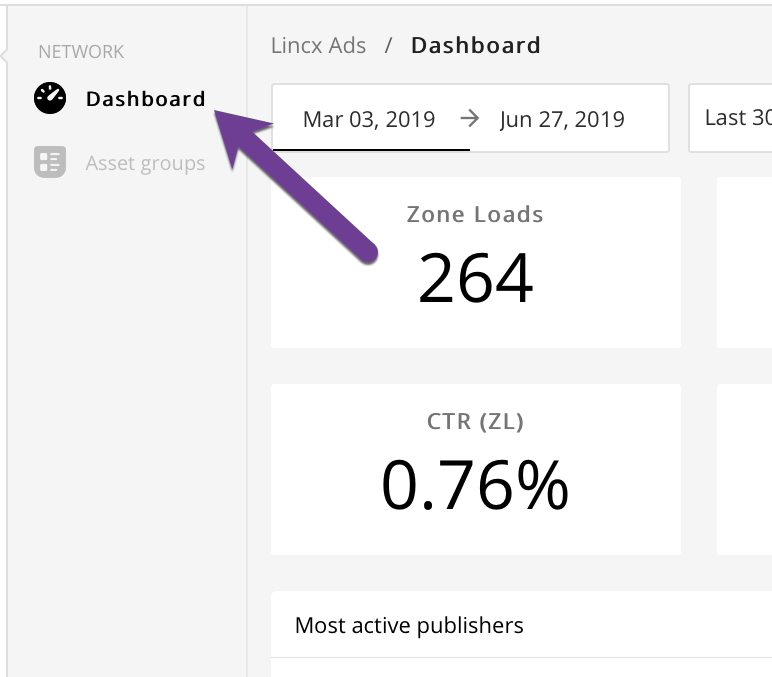
In order to find the Dashboard view, you'll need to navigate to the network tab and select the Dashboard link as depicted below.
Once on the Dashboard view you should find a grid with 10 boxes containing data regarding your ad network. The smaller boxes of the grid in the top two rows will indicate aggregated numbers for the network over the period of time shown in the box indicated below.
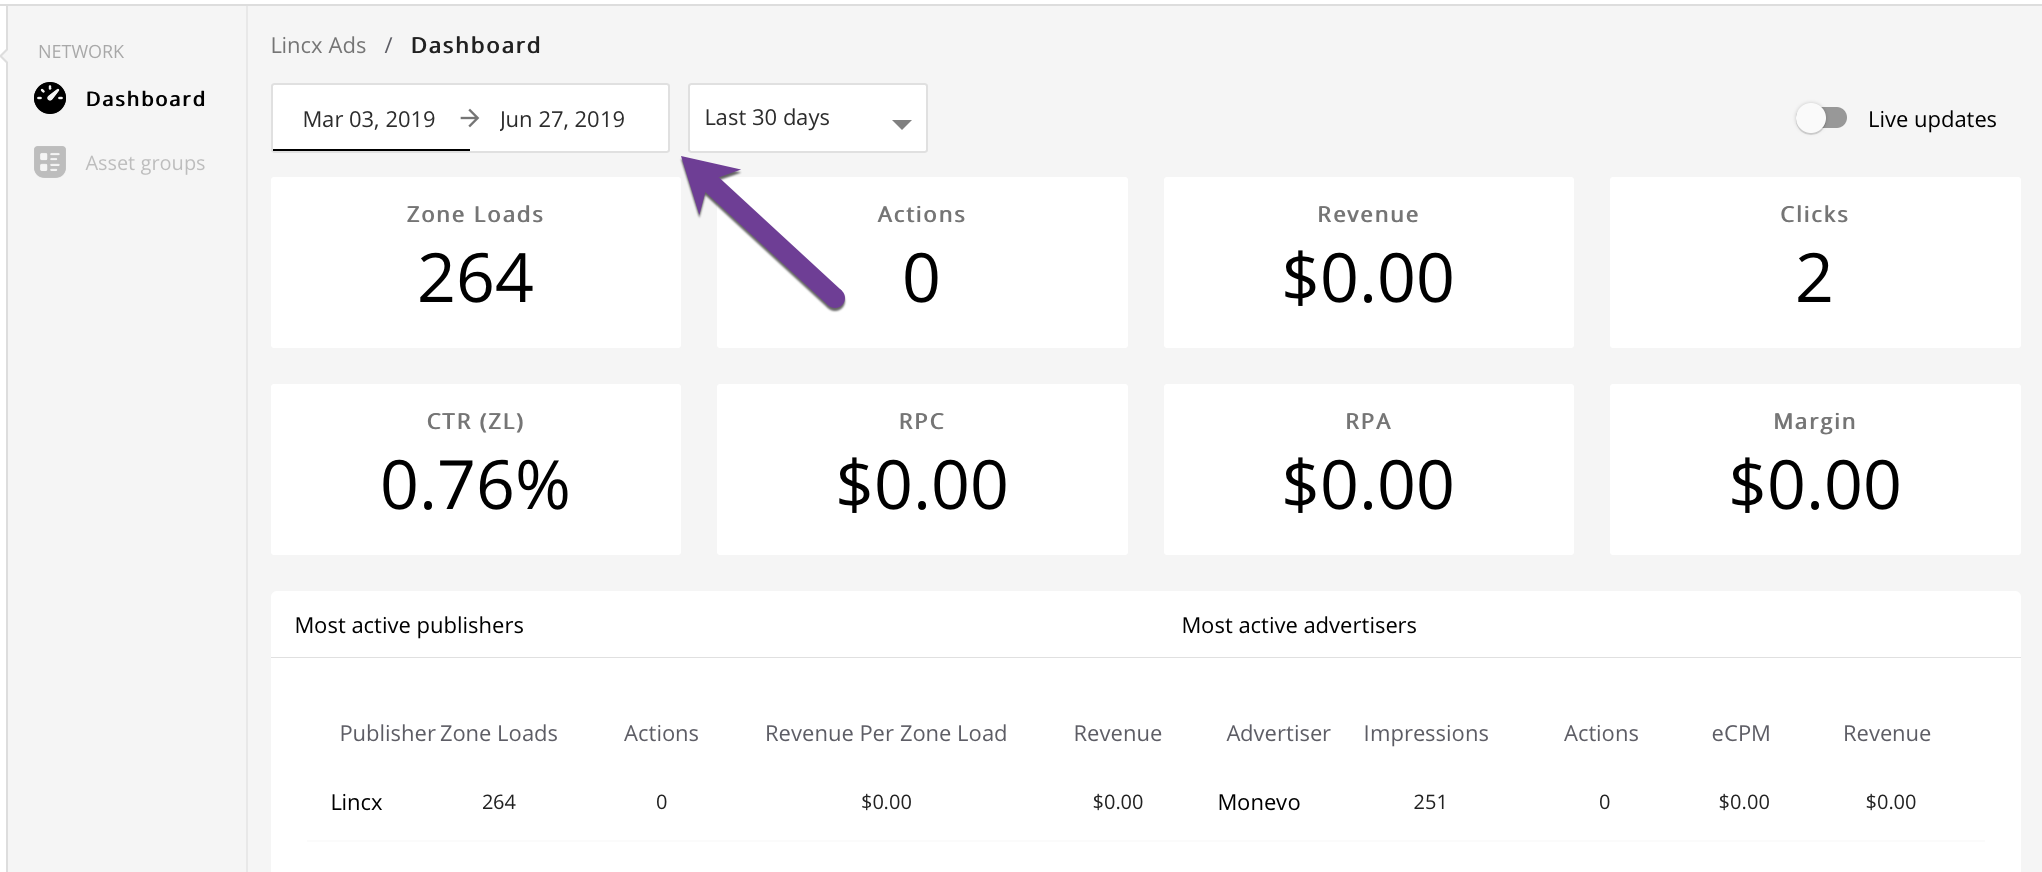
The boxes in the grid each have their own data to return and are defined as follows (over the specified period of time):
- Zone Loads: Numeric value indicating how many times that Zones were loaded
- Actions: Numeric value indicating the number of Actions
- Revenue: Monetary value indicating the revenue earned
- Clicks: Numeric value indicating the number of Ads clicked on
- Click Through Rate (CTR): Percent value indicating the percentage of people who click through an Ad
- Revenue Per Click (RPC): Monetary value indicating the average revenue brought in per click
- Revenue Per Ad (RPA): Monetary value indicating the average revenue brought in per Ad
- Margin: Monetary value indicating the profit margin for the network
There is a 3rd row with further data that will show the most active Publishers and most active Advertiser data.